Portfolio Analytics
Choose shops and dates, review sales activity, and download or compare results.
Review your portfolio
These reports summarize orders and shop activity recorded in DabDash. Revenue totals are shown in USD so you can review shops together. The reports use the shops available to your Dabmaster account.
Start with Revenue to review revenue, orders, new customers, and activity by zone. Open Needs attention to review trials ending soon, expired subscriptions, and shops with no revenue orders today.
Choose shops and dates
At the top of a report, choose a date range and the shops you want to include. Keep All sites selected to review the full portfolio, or select specific shops to focus the report. Your choices carry over as you move between reports.
On Revenue, the chart starts with Net revenue. Use Metrics to add Gross revenue, Orders, or AOV. The cards summarize revenue, orders, and new customers for the selected dates.

Download or compare results
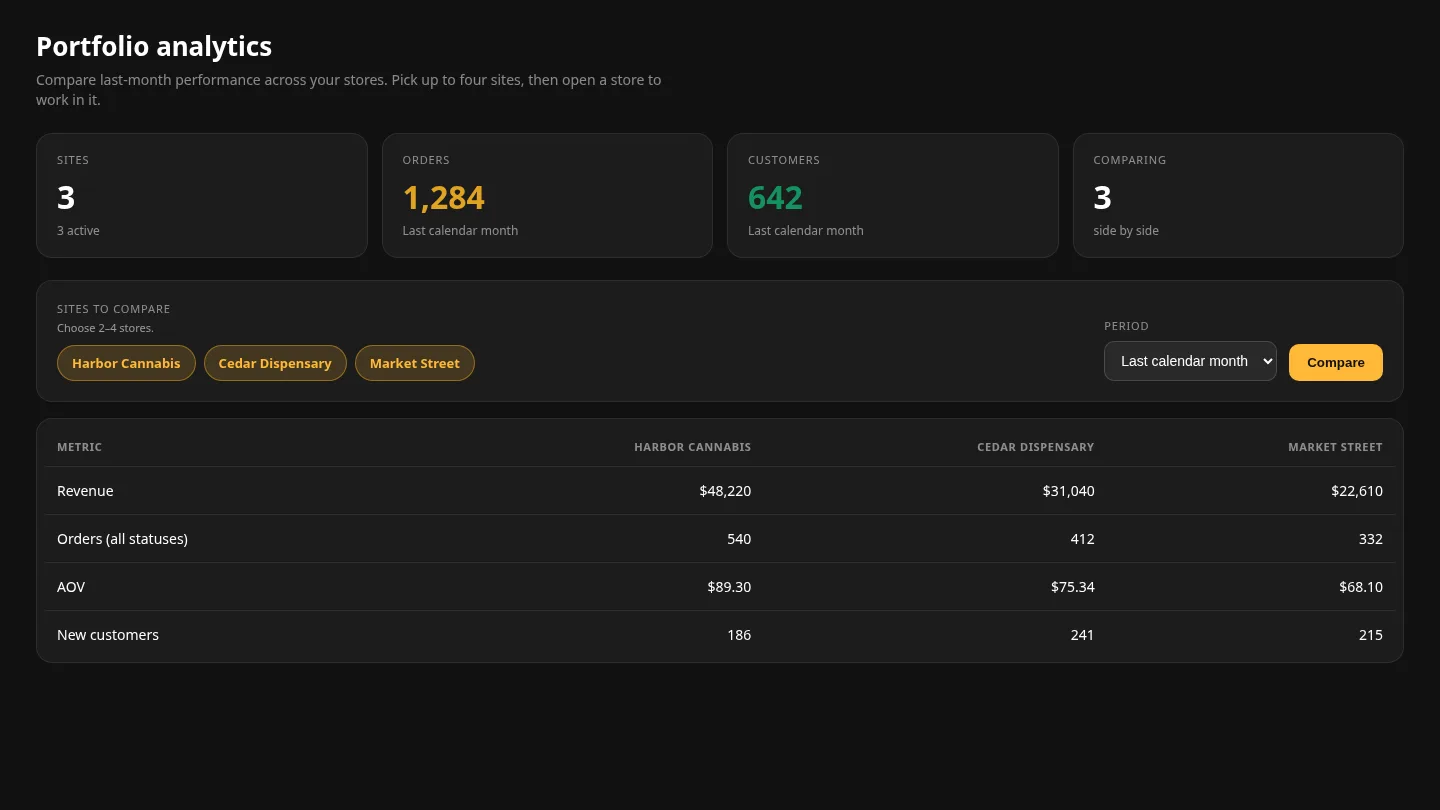
Select Full portfolio CSV to download the revenue report for your current date and shop selection. To compare shops, select up to four in the shop filter at the top of the page. The comparison cards appear below the chart when results are available.
Guided tour
On Analytics, open Help → Start tour. Follow it to choose shops and dates, adjust the Revenue chart, review the summary cards, download a CSV, and compare shops.